Example work
The type of Google Analytics 4, Google Ads, SEO, and social reporting problems Veld Analytics helps solve.
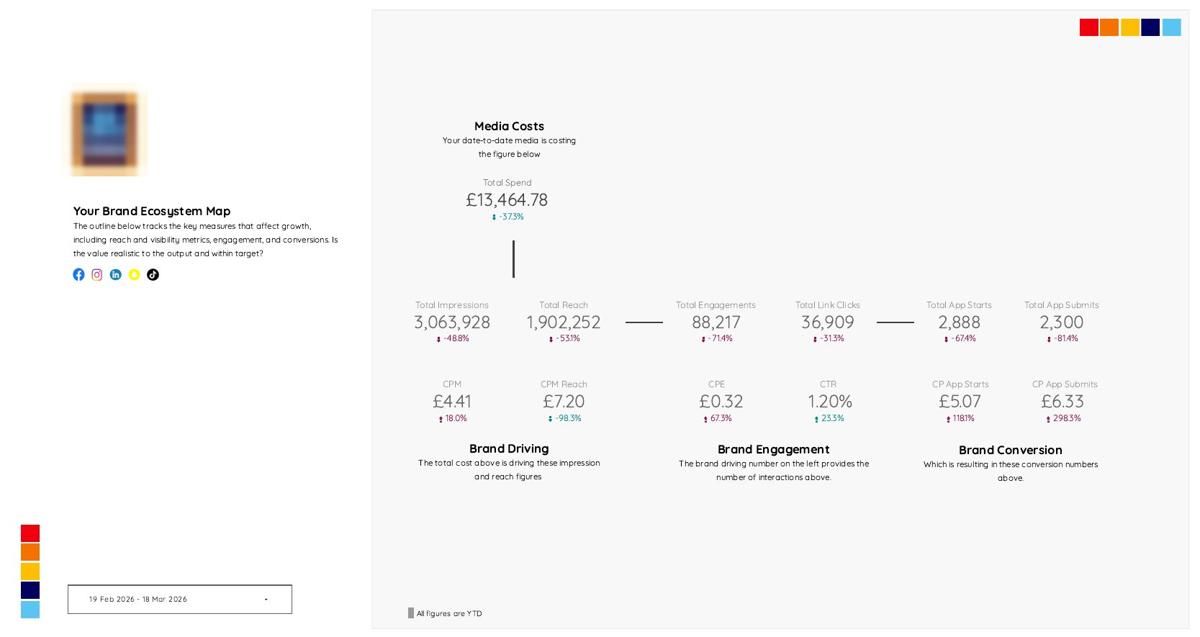
GA4 Journey Mapping
Problem
The business had raw Google Analytics 4 event data but no clear view of how users moved through a key digital journey.
Output
A dashboard-ready journey model showing user behaviour, step completion, drop-off, and conversion patterns.
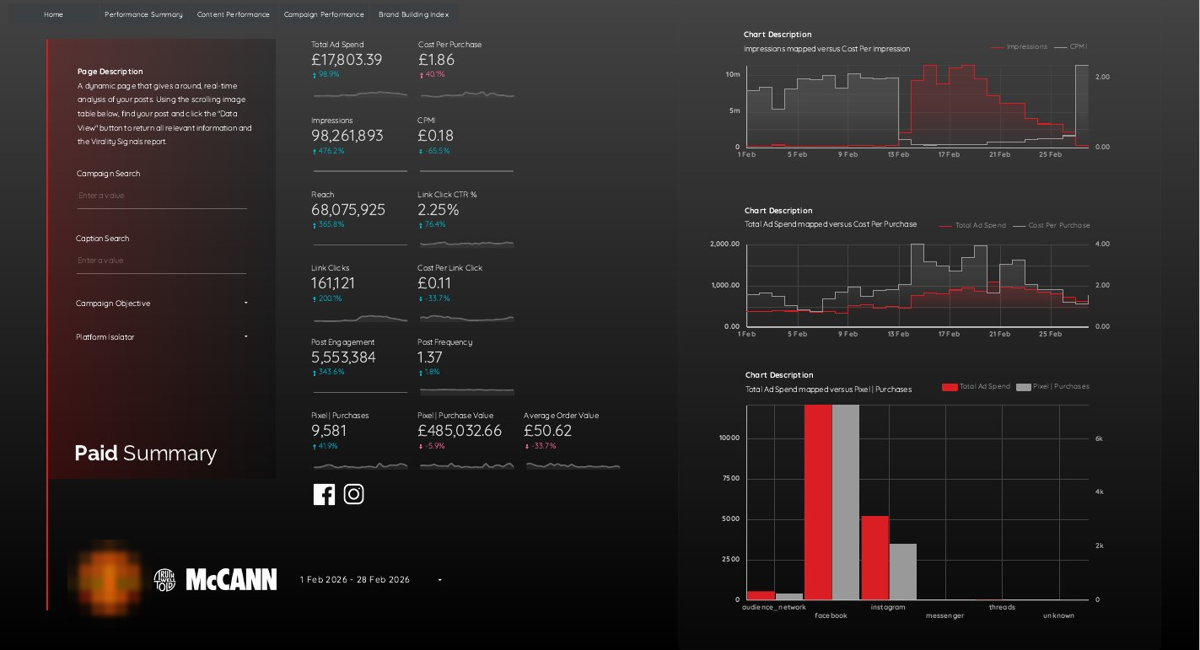
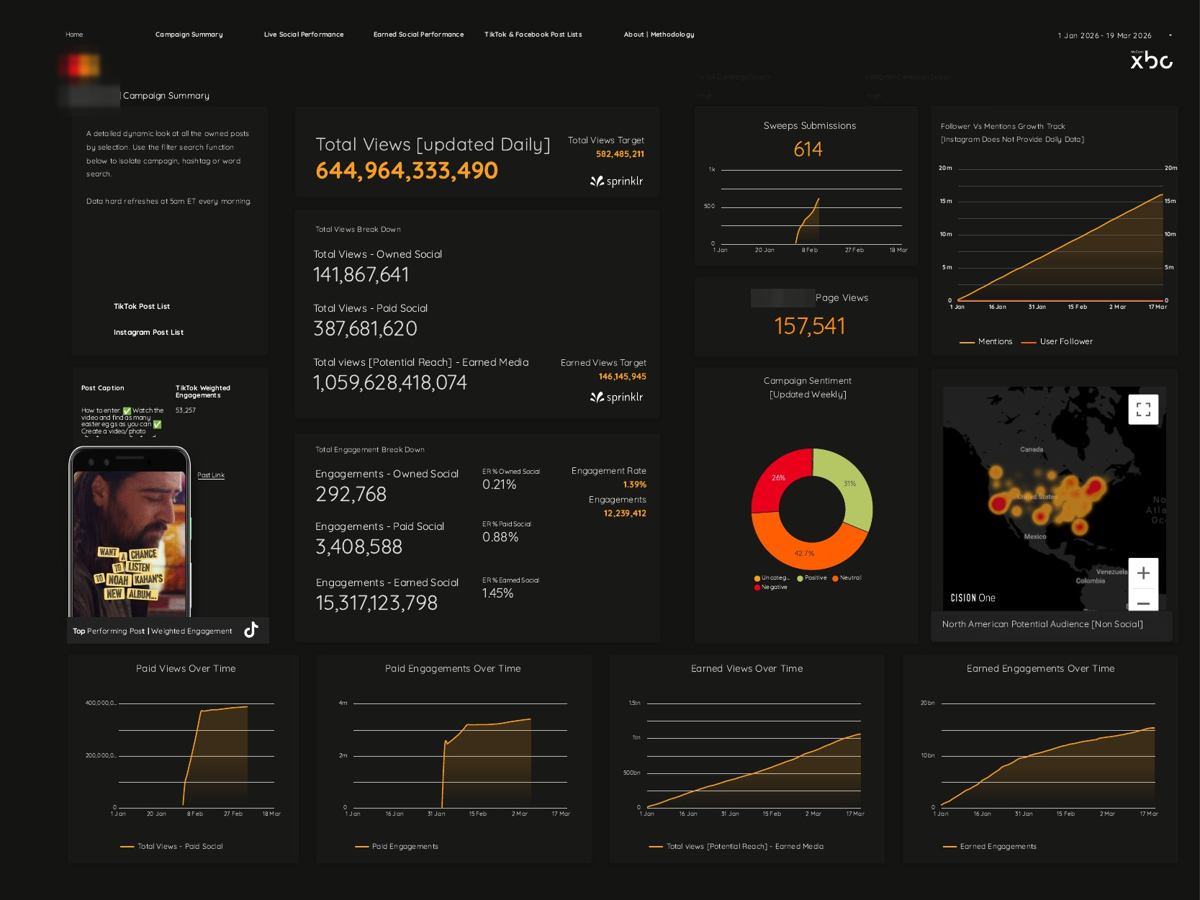
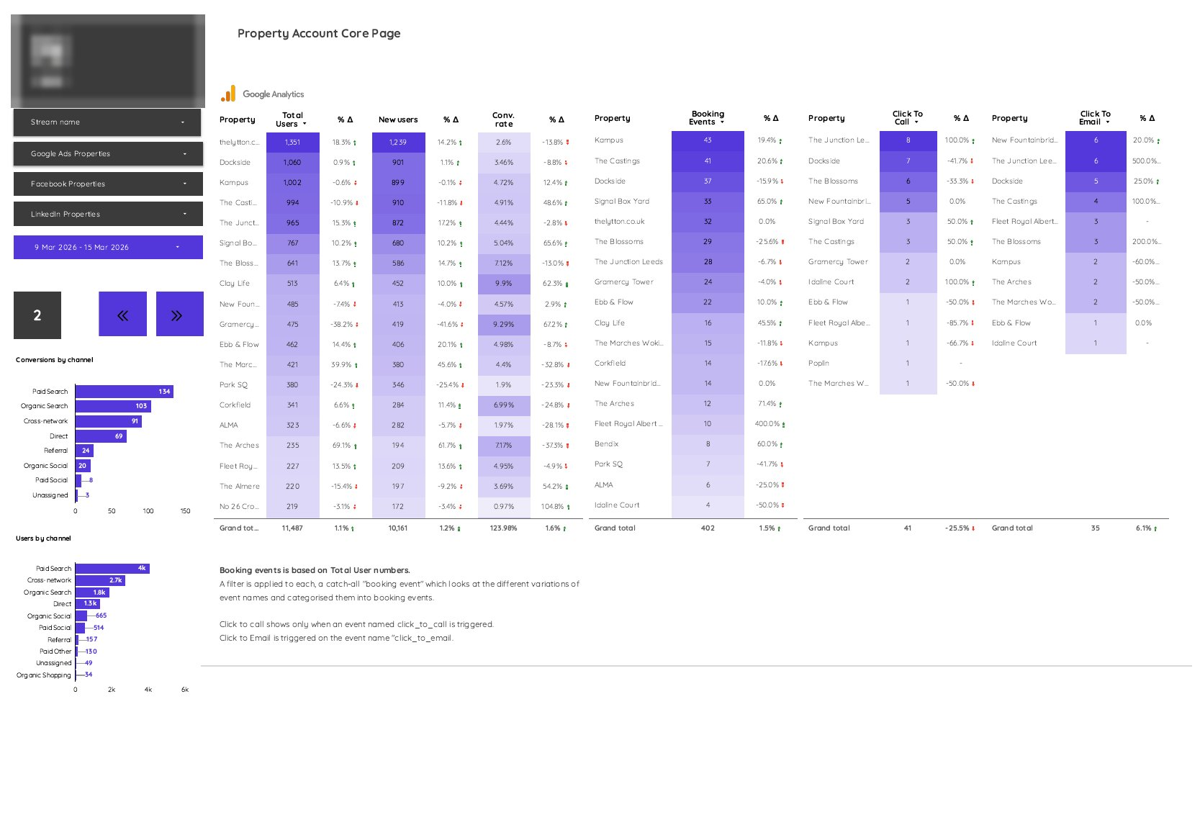
Google Ads & Paid Social Reporting System
Problem
Paid performance data was spread across Google Ads and Meta Ads Manager, with inconsistent reporting and no single trusted view.
Output
A single trusted reporting layer for paid search, paid social, and conversion performance.
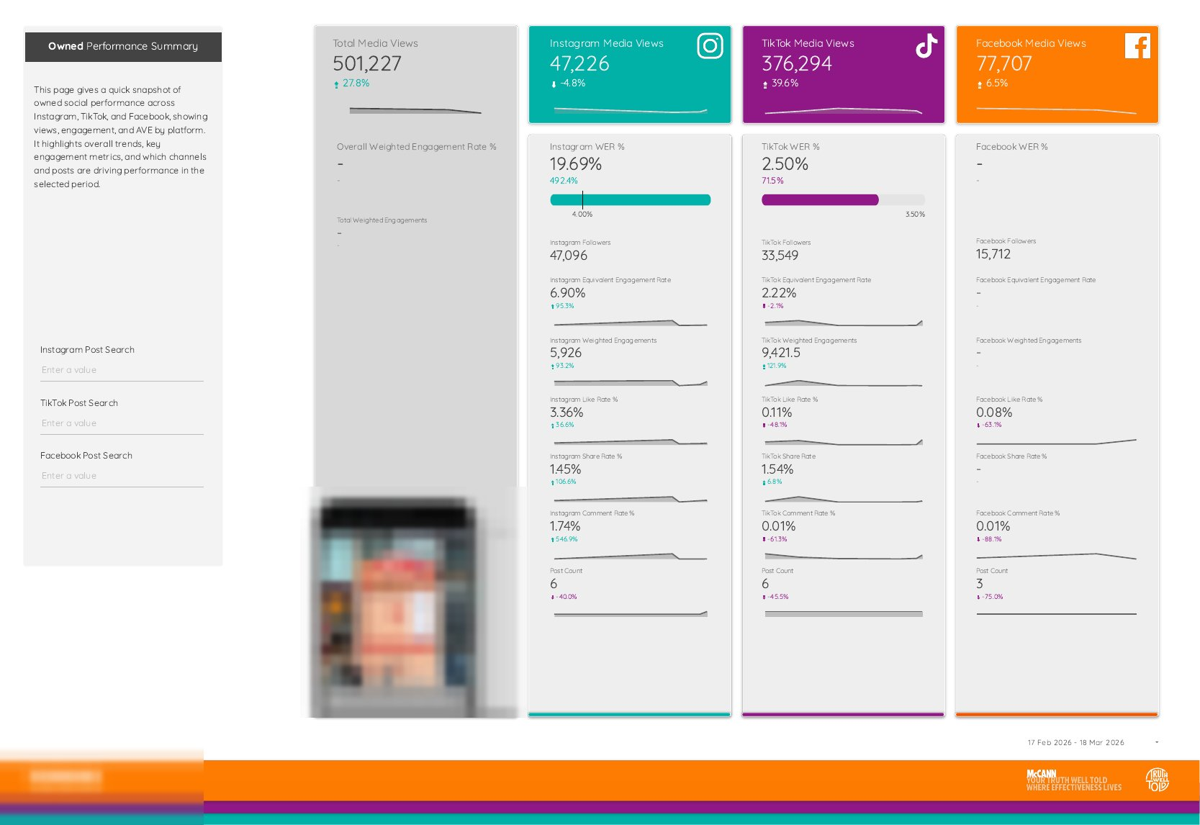
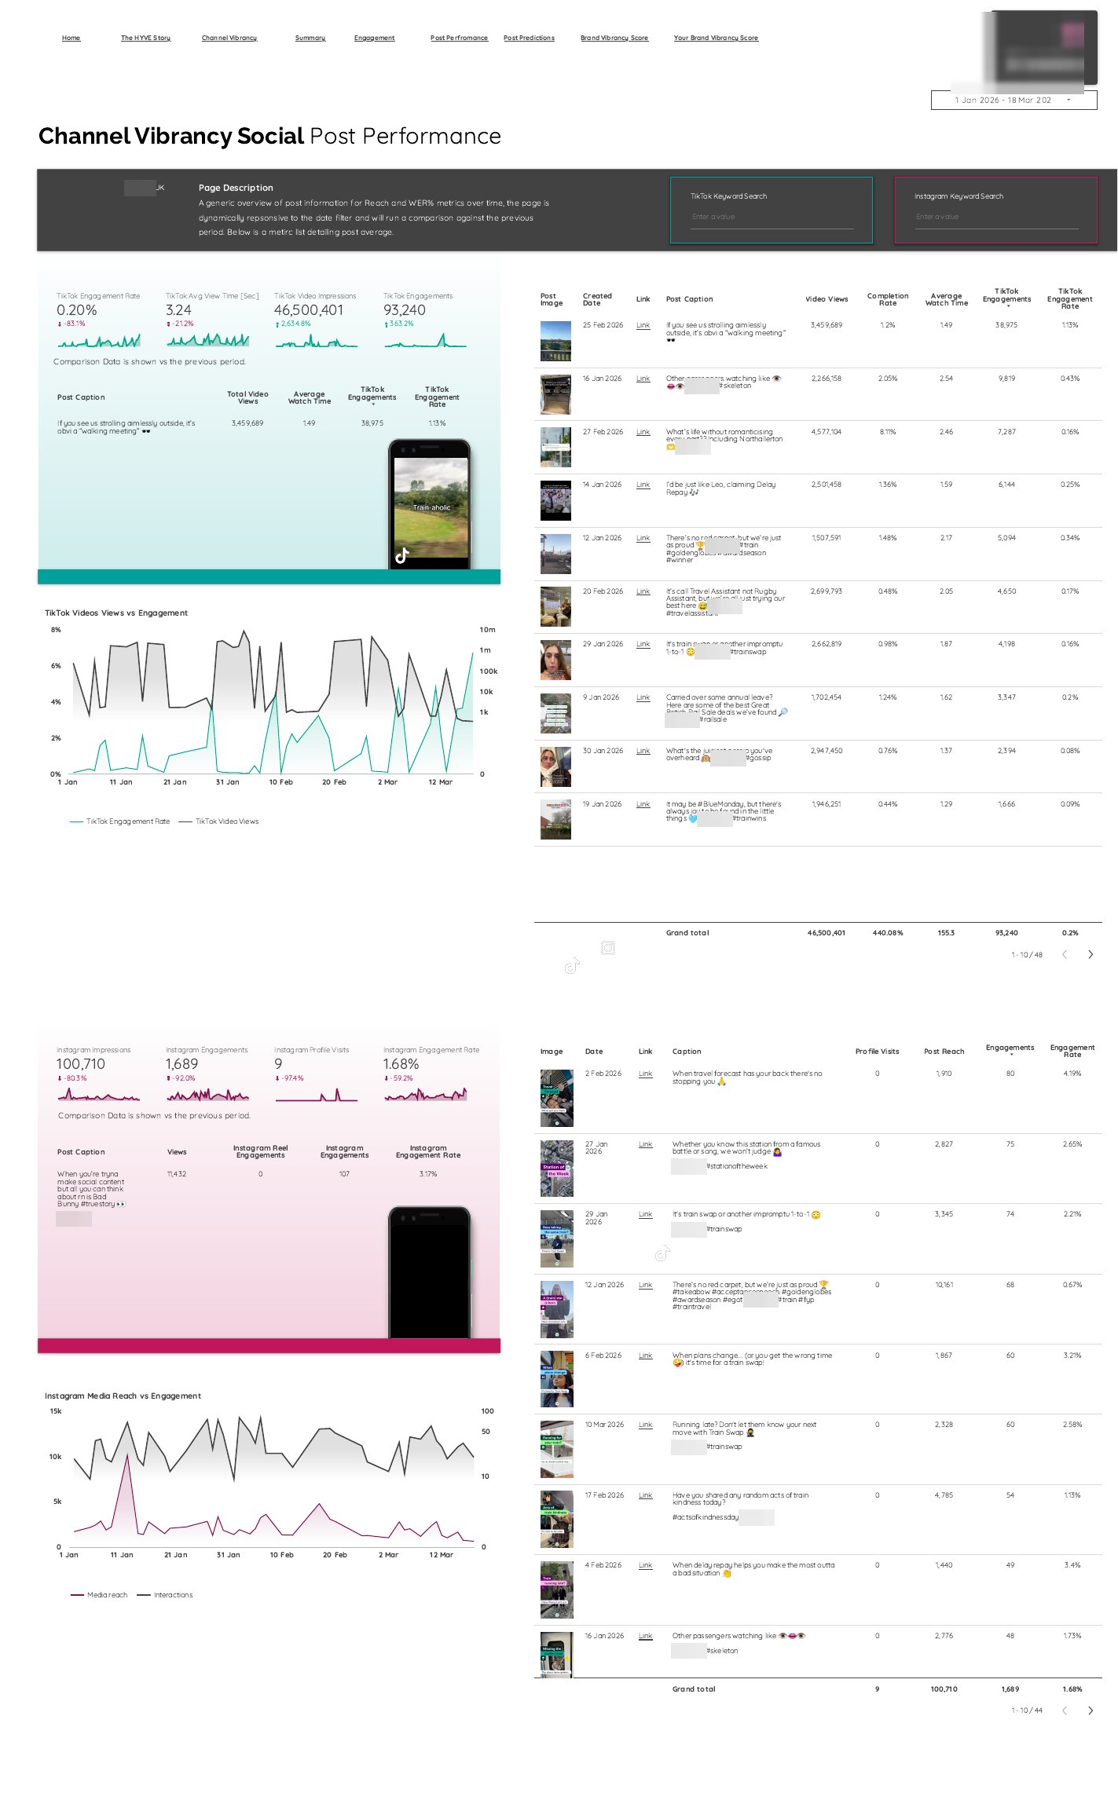
Organic Social Reporting Build
Problem
The team posted across three platforms but couldn't say which content actually drove growth or engagement.
Output
A single organic social dashboard showing growth, engagement, and content-type performance over time.